Salem Village Pie Charts

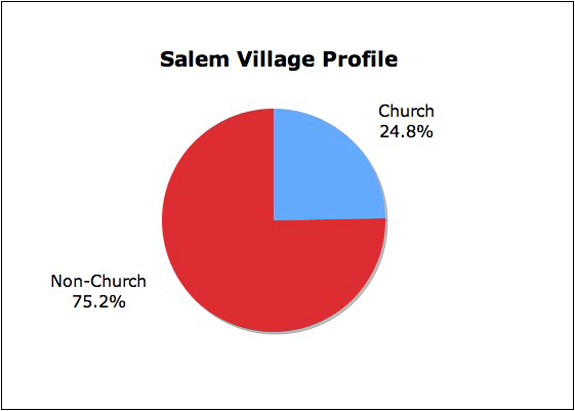
To construct a pie chart comparing Salem Village's church members and non-church members, use the data in the Salem Village pivot table. Open the Chart Wizard and choose "Pie." Click the "Data Range" icon and drag the mouse through the "Church" and "Non-Church" labels in the second row of the pivot table. Release the mouse, hold down the Command key, and drag through the two "Grand Total" data cells for "Church" and "Non-Church" in the sixth row. Release the mouse, and click the "Data Range" box to return to the Chart Wizard window. The "Rows" button should be selected, indicating "series in" rows. Click "Next" and edit the chart in the Chart Options window. Further editing can be made in the final chart image by right-clicking the labels and selecting "Format Data Labels." The chart reveals that for Salem Village, as for most New England communities, church members constituted a minority of the population.
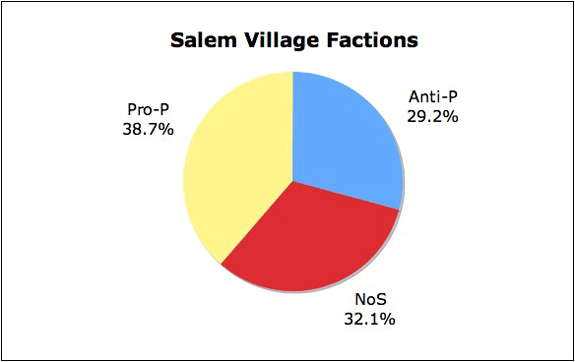
A pie chart also nicely displays the relative sizes of different groups of taxpayers. Using again the data in the Salem Village pivot table, open the Chart Wizard and choose "Pie." Click the "Data Range" icon and drag the mouse through in the "Anti-P," "NoS," and "Pro-P" label cells in the first column. Release the mouse, hold down the Command key, and drag through the three "Grand Total" sums for the three groups in the fourth column. Release the mouse, and click the "Data Range" box to return to the Chart Wizard window. The "Columns" button should be selected, indicating "series in" columns.

The chart provides a snapshot of the way Salem Village divided its loyalties during the witchcraft period. The largest group continued to back their minister. Parris's opponents, however, constituted almost 30% of the adult taxpayers. That fewer than 40% of all Salem Village taxpayers petitioned on Parris's behalf may help explain his decision to leave his post in 1696, a year after the petitions circulated in the village. Even with additional numbers of women supporters, the combined strength of the anti-Parris group and non-signers may have discouraged Parris from continuing in his position.
To return to the Salem Village Social Characteristics page, click Back or Next.